
Phosphorescent Markers on D-Day: 1944 and 2025
By Christopher J. Bell and Nicola Tisato · Originally published July-August 2025 · pp. 58–65
Phosphorescent Markers on D-Day: 1944 and 2025 With Cautionary Notes for Collectors By Christopher J. Bell and Nicola Tisato Department of Earth and Planetary Sciences, The University of Texas at Austin, Austin, TX 78712
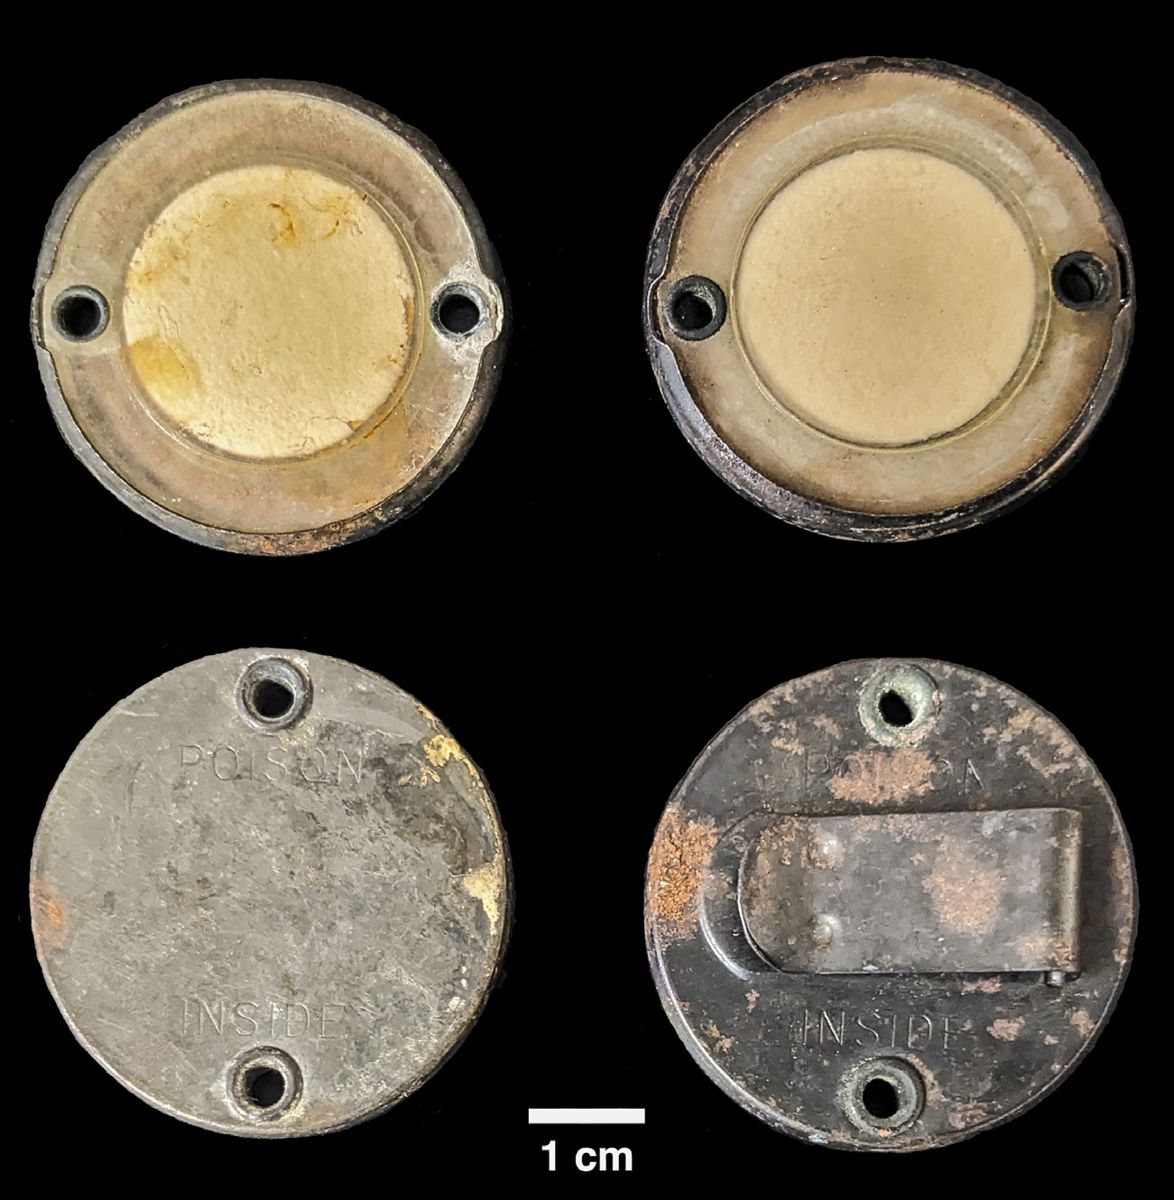
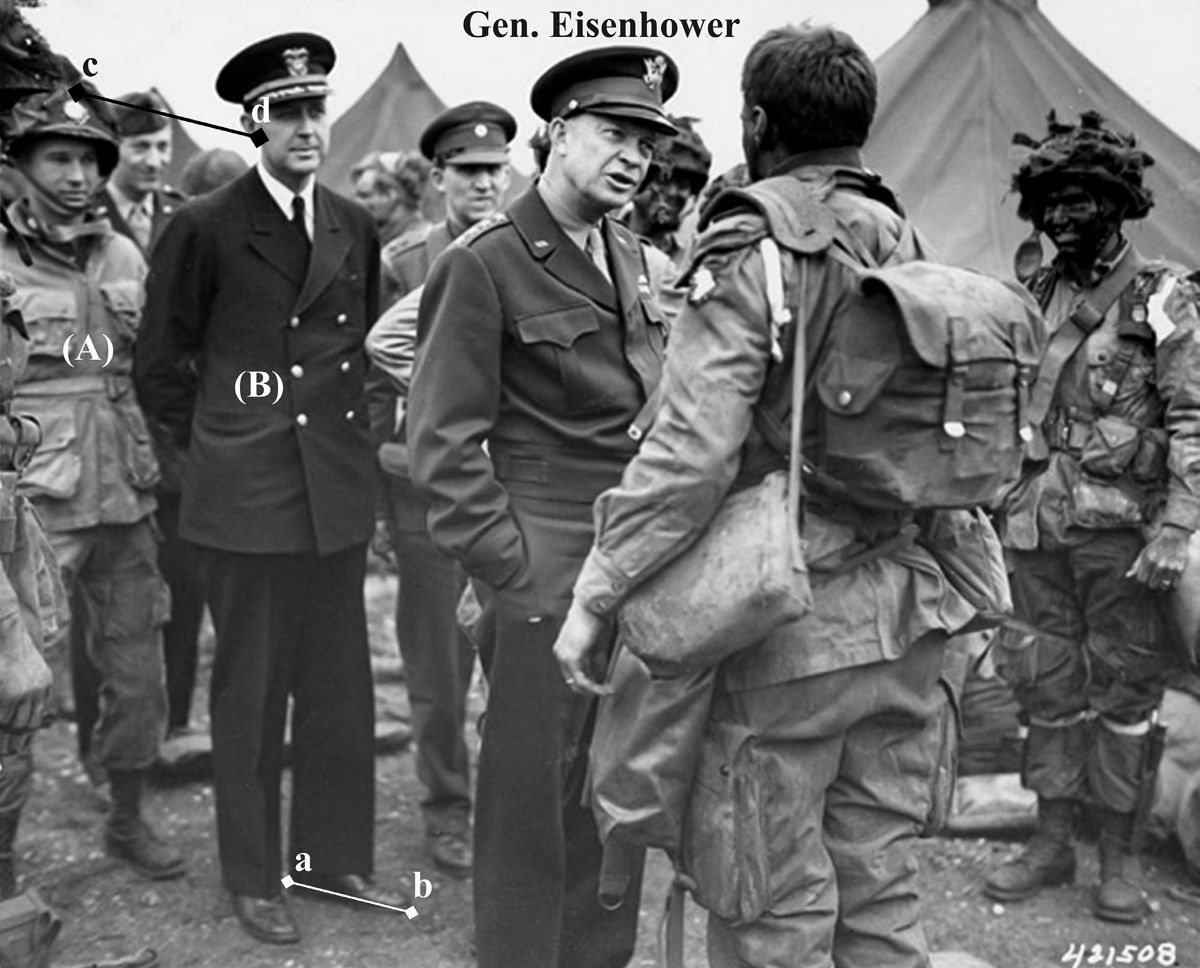
Among the many interesting collectibles from the American paratrooper operations on D-Day are small, phosphorescent disks that emitted a faint greenish glow. The disks contain radium (Ra-226) whose radiation causes phosphorescent materials (for example, zinc sulfide1) to glow. The disks were used to mark pathways to rendezvous points and as markers worn on the back of helmets so soldiers could easily follow their leaders during night operations in the early hours of D-Day. These markers are still circulating among collectors and can be found and purchased at military collector’s shows, through dealers, and via the Internet. As curiosities associated with the nighttime operations on D-Day, they are attractive items for collectors specializing in paratrooper weapons and equipment generally, or those collecting materials associated with D-Day operations. There is, however, need for caution in handling, collecting, storing, and displaying these disks. Several different designs of the disks were produced, and apparently in various abundance. We tested two designs that were recently illustrated in a booklet on weapons and equipment of American paratroopers on D-Day.2 Both have a gently curved glass facing on the obverse side, and the reverse side of both is clearly marked poison inside. On one, the backing is otherwise plain and unornamented (‘plain-disk’). The second design (‘clip-disk’) has a clip attached to the back to facilitate attachment of the disk to a helmet net or to vegetation in the field (Figure 1). Photographs of paratroopers wearing phosphorescent disks on their helmets and photographs of the disks included in collections of small equipment carried by paratroopers were published by Michel de Trez in his book American Warriors.3 Among these is a photograph from a famous series depicting General Dwight Eisenhower meeting with paratroopers of the 101st Airborne prior to their departure for France. That photo is now in the public domain via the Eisenhower Presidential Library (https://www.eisenhowerlibrary.gov/media/3044) and is reproduced here as Figure 2. We pose four real-world scenarios to contextualize the potential impacts of carrying, wearing, or being in close proximity to the disks, both for WWII paratroopers and for collectors today. To explore those potential impacts, we ran a series of eight experiments using two disk designs. Experiments were intended to measure the gamma radiation emitted by the disks today and use those results to estimate the radiation dose received by paratroopers who wore the disks on D-Day. Measurements were taken in a laminar fume hood hosted by the Rock Deformation Laboratory in the Jackson School of Geosciences at The University of Texas at Austin. We present the results of our experiments here, along with cautionary notes for collectors and brief comments on storage considerations for collectors. We report data on radiation dose in microsievert units (mSv), and dose rates as microsievert/hour (mSv/h). We record potential dose rates on a logarithmic scale to present the wide range of values we measured. To make the microsievert unit more comprehensible, we present our data on that figure as equivalent to a standard dental X-ray (~ 5 mSv), which is about 1/20th of a chest X-ray (100 mSv).4
SCENARIOS Scenario 1: An officer (or collector) keeps a disk in their pocket with the glass dome facing inward towards the body. Figure 1. Obverse and reverse sides of the disks used in our experiments. The plain-disk is on the left, the clip-disk on the right. The reverse side of each disk is marked ‘POISON INSIDE.’ They are otherwise unmarked.
Scenario 2: An officer (or collector) keeps a disk in their pocket with the glass dome facing outward away from the body.
Figure 2. General Dwight Eisenhower met with paratroopers of the 101st Airborne before their departure for France. The officer at the far left (labeled (A) on the image) is wearing a phosphorescent marker disk on the front of his helmet. An estimate of the length of the shoe of the officer in the dark uniform (line segment a-b) was used to calculate an approximate distance between him and the officer wearing the disk (line segment c-d). See text for details.
Scenario 3: An officer wears the disk on the front of the helmet for some length of time, suffering a radiation dose to parts of the brain. Scenario 4: An officer wears a disk on the front of the helmet and converses quietly with another person at a distance of at 40 cm for some length of time or at a more normal conversational distance of 60 cm.
done with the clip-disk attached by a loop of twine to a WWII paratrooper helmet seated on a Styrofoam manikin head; those experiments were not repeated with the plain-disk because we could not as easily secure it to the helmet.5 For Experiments 5 and 6 the disk was placed at the front of the helmet (slightly higher than in the position shown in Figure 2, but comparable to the position depicted on a manikin on page 192 of American Warriors by Michel De Trez.3
EXPERIMENTS
Experiment 1
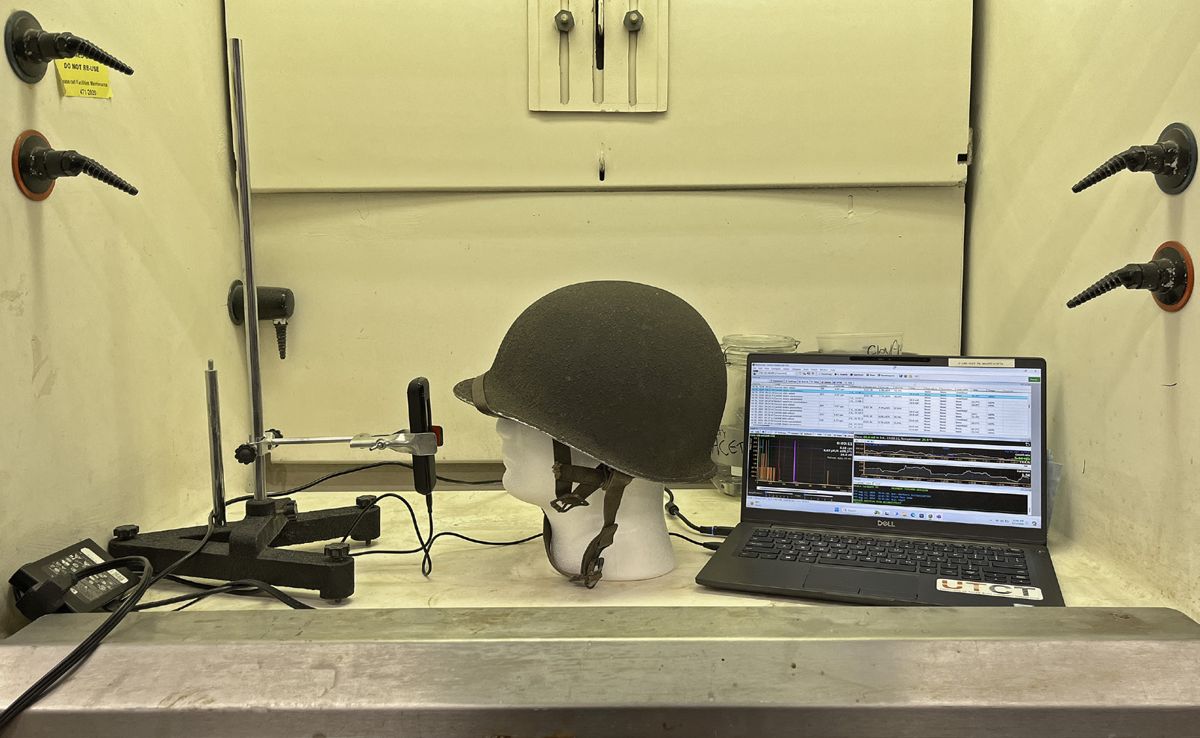
We used a Radiocode 103 (10X Series) radiation detector for our experiments. The setup for each experiment is illustrated in Figure 3. The first two experiments measured the emissions from the front and back of each disk. Experiments 3 through 8 were
The detector was placed close (2 cm) above the glass dome of the plain-disk (Figure 3A). Then the plain-disk was replaced by the clip-disk for a new round of measurements.
Photographs of our experimental apparatus. A. The detector was placed 2.0 cm above the glass dome (obverse side) of the plain-disk. B. The detector was placed 2.0 cm above the reverse side of the plain-disk. C. The detector was placed inside the front of the helmet, and the clip-disk was suspended by twine at the back of the helmet, with the dome facing backward. D. The detector was placed inside the back of the helmet with the disk suspended at the back with the dome facing backward. E. The detector was placed inside the front of the helmet, and the disk was suspended at the front with the dome facing forward. F. The detector was placed inside the back of the helmet, and the disk remained suspended at the front, facing forward. G. The disk was placed at the front of the helmet facing forward. The detector was placed at the same height as the disk, and the detector and disk were separated by 40 cm.
Plain-disk: 39 measurements over 62 minutes yielded a dose rate of 181.15+/-1.08 mSv/h.
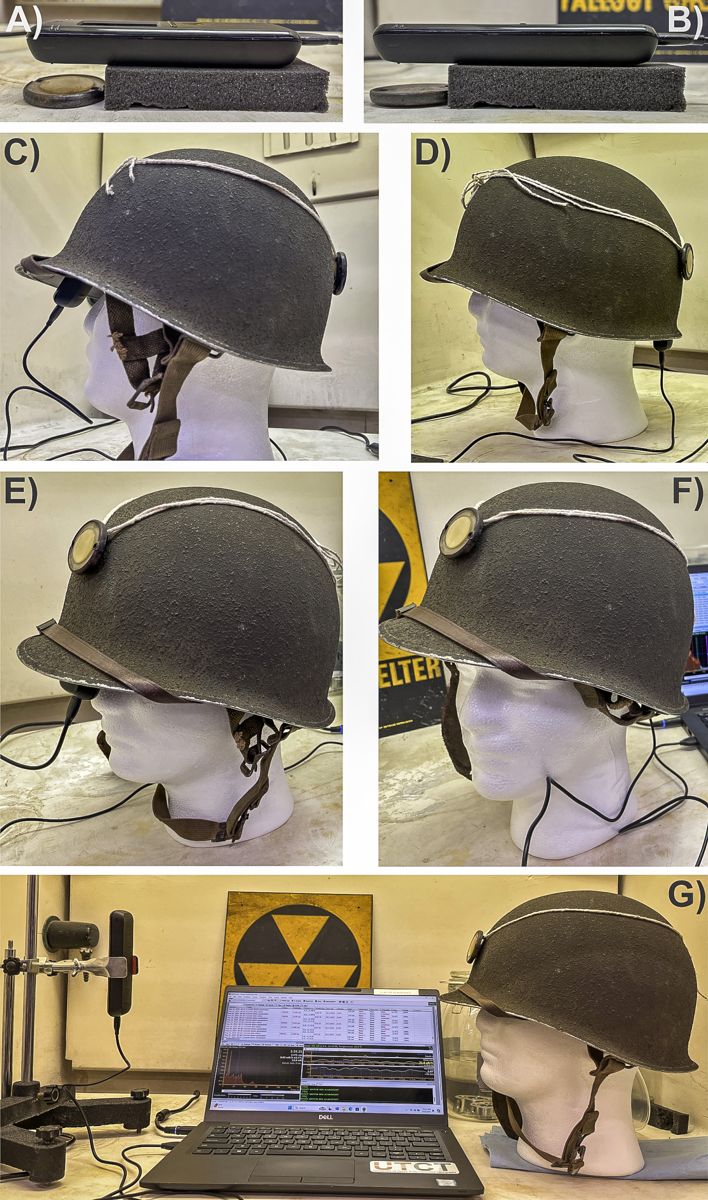
the helmet with the dome facing forward (Figure 3E).
Clip-disk: 41 measurements over 62 minutes yielded a dose rate of 323.54+/-1.394. We speculate that part of the reason for the clip-disk delivering a higher dose rate than the plain-disk is that the detector was in a fixed position in Experiment 1, and the clip on the back of the second disk lifted the obverse side closer to the detector, increasing the detected radiation. Support for this suggestion to explain the dissimilarity between disks is that the measured dose rates were much closer to each other in Experiment 2 (see below, when the reverse side of each disk was facing the detector).
Clip-disk: 80 measurements over 2 hours yielded a dose rate of 75.67+/-0.68 mSv/h.
Experiment 2
Experiment 7
The detector was placed close (2 cm) above the reverse side of the plain-disk (Figure 3B). Then the plain-disk was replaced by the clip-desk for a new round of measurements.
The disk was placed at the front of the helmet facing forward. The detector was placed at the same height as the disk, and the detector and disk were separated by 40 cm (Figure 3G).
Plain-disk: 42 measurements over 68 minutes yielded a dose rate of 115.64+/-0.81 mSv/h.
Clip-disk: 64 measurements over 103 minutes yielded a dose rate of 0.81+/-0.07 mSv/h.
Clip-disk: 536 measurements over 14 hours yielded a dose rate of 122.82+/-0.87 mSv/h.
Experiment 3 The detector was placed inside the front of the helmet, and the disk was suspended at the back of the helmet with the dome facing backward (Figure 3C). This simulates the dose received at the frontal region of the skull and brain when the disk was worn on the back of the helmet. Clip-disk: 907 measurements over 24 hours yielded a dose rate of 1.89+/-0.11 mSv/h.
Experiment 4 The detector was placed inside the back of the helmet, and the disk remained at the back with the dome facing backward (Figure 3D). This simulates the dose at the occipital-parietal region of the skull and brain when the disk was worn on the back of the helmet. Clip-disk: 266 measurements over 7 hours yielded a dose rate of 55.96+/-0.57 mSv/h.
Experiment 5 The detector was placed inside the front of the helmet, and the disk was suspended at the front of
Experiment 6 The detector was placed inside the back of the helmet, and the disk remained suspended at the front of the helmet, facing forward (Figure 3F). Clip-disk: 613 measurements over 16 hours yielded a dose rate of 1.93+/-0.1 mSv/h.
Experiment 8 (not illustrated) The disk was placed at the front of the helmet facing forward. The detector was placed at the same height as the disk, and the detector and disk were separated by 60 cm. Clip-disk: 67 measurements over 108 minutes yielded a dose rate of 0.39+/-0.05 mSv/h. In Figure 4 we provide a visualization on a logarithmic scale of the radiation dose generated by the disks under our four scenarios. To exemplify the interpretation of data we use four cases described below and represented by colored symbols in Figure 4. Scenario 1: An officer (or collector) keeps a disk in their pocket with the glass dome facing inward towards the body. This is simulated by Experiment 1. In Figure 4, we plot data from the plain-disk to avoid overestimating the dose rate that would result from using the clip-disk (see discussion under Experiment 1 above). We note that in our experiment, the distance of the disk from the detector was 2 cm, but the distance between a disk and a person’s body when carrying a disk in their pocket will be much shorter (the thickness of clothing separating the disk from the skin), and the resultant dose much higher. In Case 1 (inverted red triangle in Figure 4), a collector who buys a disk at a show and carries it in their pocket for 8 hours after purchase, with the dome
Figure 4. Visualization on a logarithmic scale of the radiation dose generated by the disks under our four scenarios. Dose data are given in mSv (right side) and the equivalent in dental X-rays (left side, with a dental X-ray taken to be ~ 5 mSv, approximately 1/20th of a chest X-ray at 100 mSv). The duration of exposure is expressed on the x-axis at the bottom of the image. Scenario 1 was simulated with Experiment 1. In Case 1 (the inverted red triangle), a collector who buys a disk at a show and carries it in their pocket for 8 hours after purchase, with the dome of the disk facing inward toward the body, would receive a dose equivalent to 290 dental X-rays to whatever area of the body is closest to the disk. Scenario 2 was simulated by our Experiment 2. In Case 2 (the red star), a soldier who carried a disk loose in his pocket for 18 hours with the dome facing away from the body would have received a dose equivalent to 416 dental X-rays to whatever area of the body was closest to the disk. Scenario 3 was simulated by our Experiments 5 and 6. In Case 3 (the round red dot), we show that an officer who wore a disk on the front of his helmet for 16 hours on D-Day (e.g., from approximately 1 a.m. until 5 p.m.) would have received a dose equivalent to 124 dental X-rays at approximately the back of the frontal lobe of the brain. Scenario 4 was simulated by our Experiments 7 and 8. In our Case 4, the red square is placed at our minimum of 1 hour, and estimates an average conversational distance of ~50 cm; if officers A and B in Figure 2 had remained at that proximity for 1 hour officer B would have received a dose equivalent to 0.12 dental X-rays.
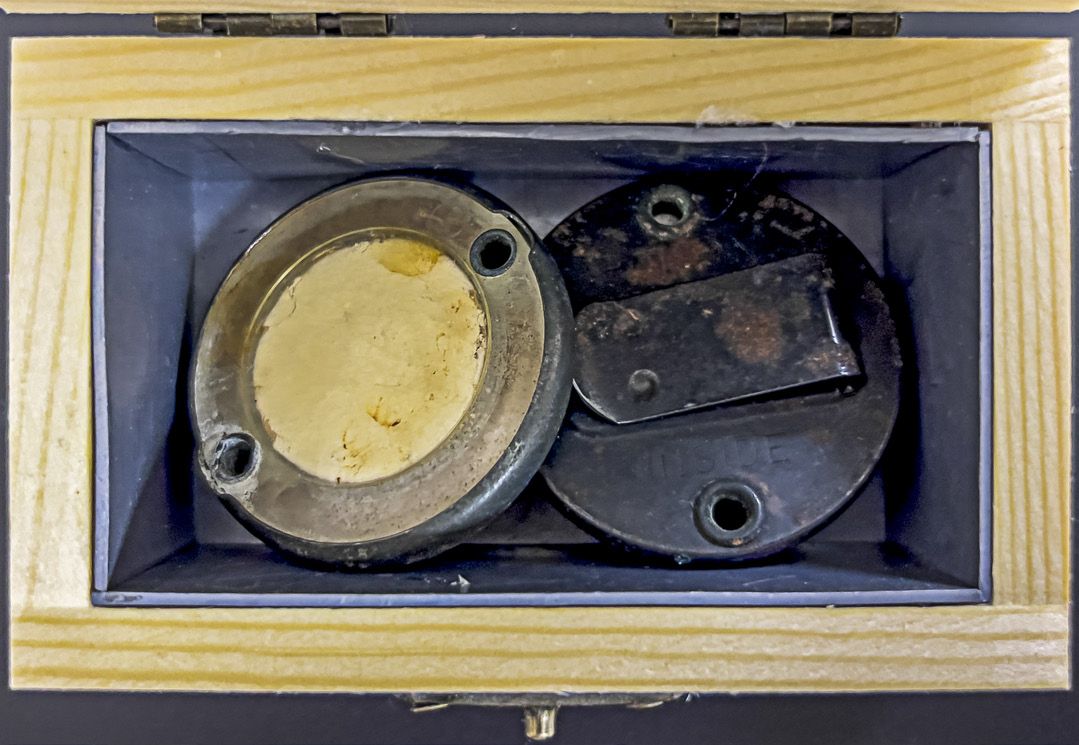
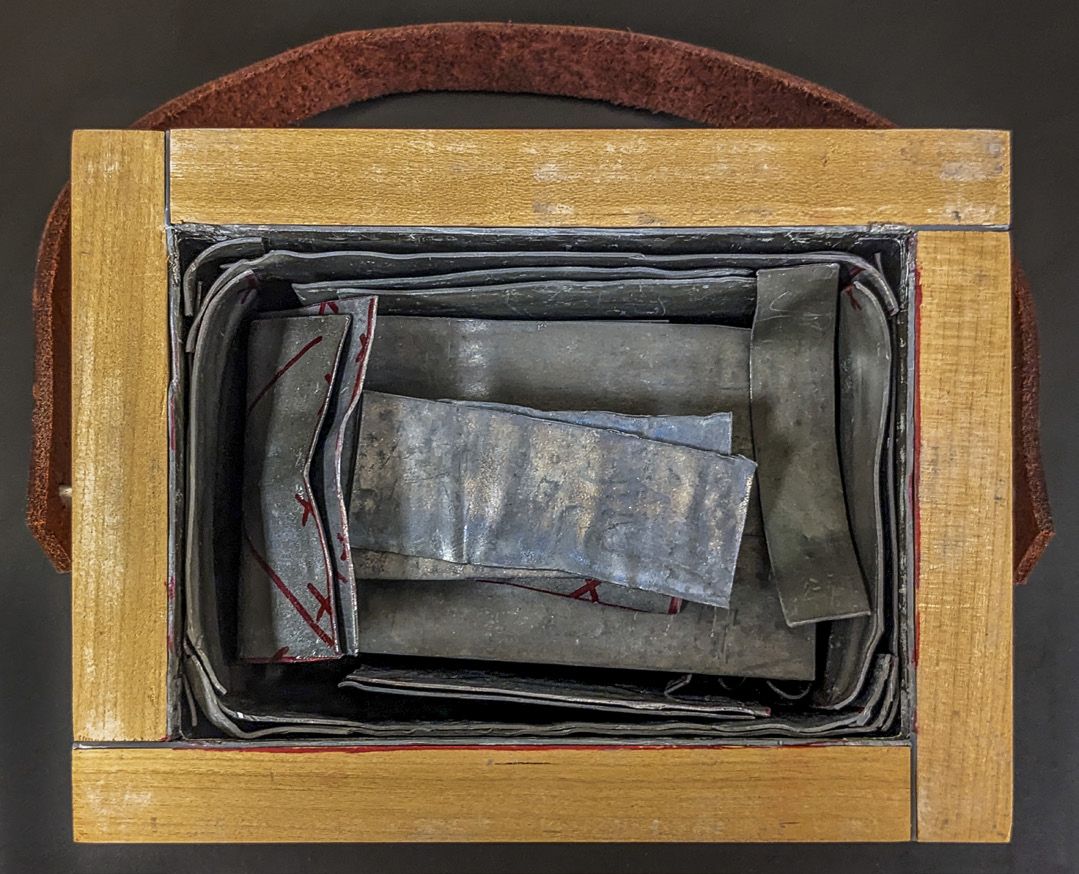
Figure 5. Two disks stored in a small box lined with 1 mm of lead – the box lid (not shown) also has 1 mm of lead. Under this storage model, the open-air emission of the two disks is reduced by 88.1%.
Figure 6. When the smaller box shown in Figure 5 is placed in a larger box with additional lead lining (yielding a total of ~ 5 mm lead thickness on all sides), the open-air emission of the two disks is reduced by 98.4%.
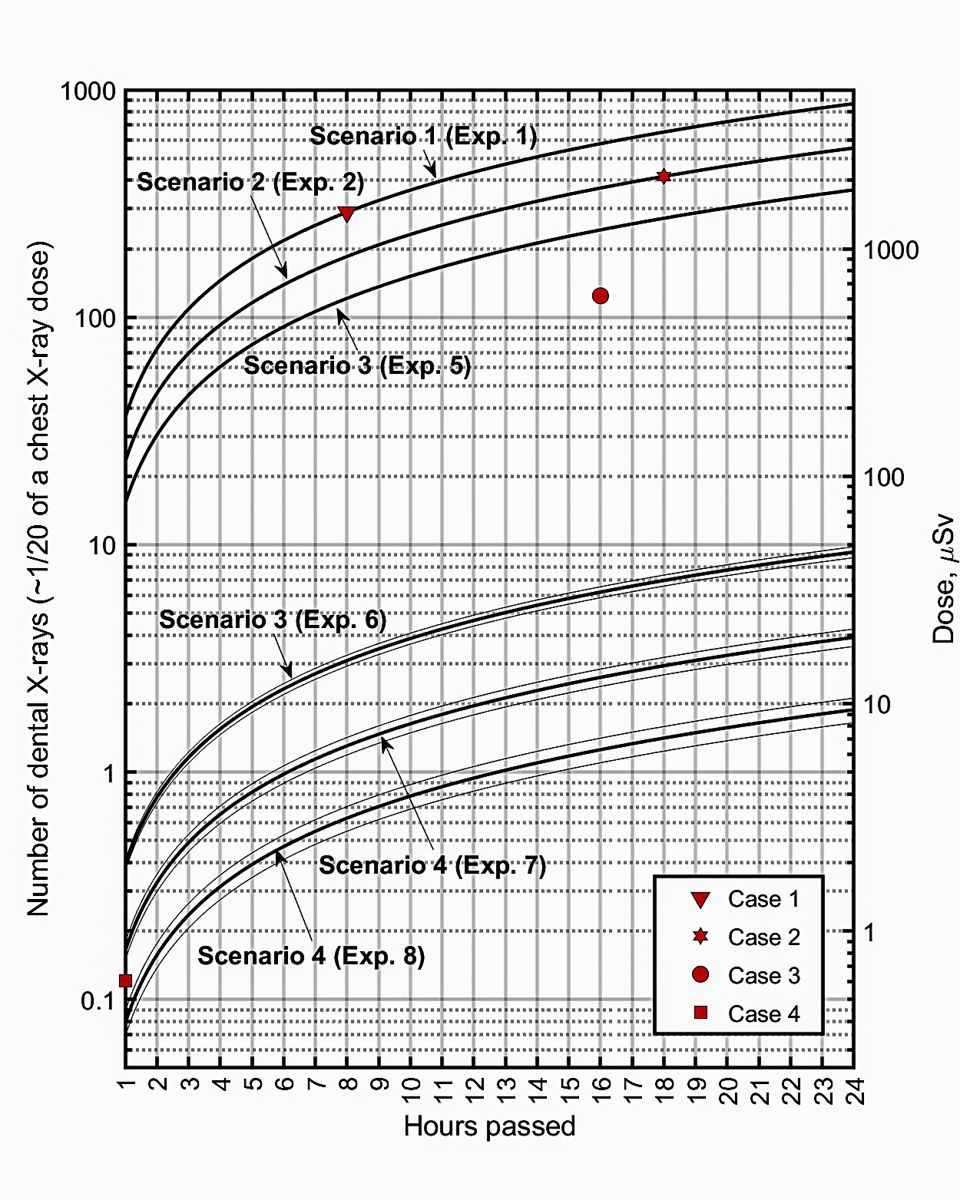
of the disk facing inward toward the body, would receive a dose equivalent to 290 dental X-rays to whatever area of the body is closest to the disk. Scenario 2: An officer (or collector) keeps a disk in their pocket with the glass dome facing outward away from the body. This is simulated by Experiment 2. In Figure 4, we plot data from the plain-disk, but we note the same caveat on distance as noted above for Scenario 1. In Case 2 (red star in Figure 4), a paratrooper who carried a disk loose in their pocket for 18 hours with the dome facing away from the body would have received a dose equivalent to 416 dental X-rays to whatever area of the body was closest to the disk. Scenario 3: An officer wears the disk on the front of the helmet for some length of time, suffering a radiation dose to parts of the brain. This is simulated by our Experiments 5 and 6. Experiment 5 (detector and disk at the front of the helmet) simulates the dose at the portion of the skull and brain closest to the disk. Experiment 6 (detector at the back of the helmet, disk at the front of the helmet) simulates the dose at the portion of the skull and brain farthest from the disk. The separation of the lines resulting from these experiments is quite large (Figure 4), emphasizing that the radiation dose decreases with distance from the disk. The space between the two lines allows estimates under different assumptions of the ‘average’ dose to the brain. In Case 3 (round red dot in Figure 4), we show that an officer who wore a disk on the front of his helmet for 16 hours on D-Day (e.g., from approximately 1 a.m. until 5 p.m.) would have received a dose equivalent to 124 dental X-rays at approximately the back of the frontal lobe of the brain. Scenario 4: An officer wears a disk on the front of the helmet and converses quietly with another person at a distance of 40 cm for some length of time or at a more normal conversational distance of 60 cm. These are simulated by our Experiments 7 and 8. In the photograph of General Eisenhower with 101st Airborne paratroopers (Figure 2), an officer toward the left side of the photo (identified with the letter A in Figure 2) is wearing a phosphorescent disk on the front of his helmet. A second officer (identified with letter B in Figure 2) stands between him and General
Eisenhower. Our 40 cm distance (Experiment 7) approximates the distance between the two officers.6 60 cm (Experiment 8) approximates a more normal conversational distance. The minimum on the x-axis in Figure 4 (hours passed) is 1 hour. Because most people would not engage in such close conversation for more than an hour, our Case 4 (red square in Figure 4) is placed at our minimum of 1 hour; and estimates an average conversational distance of ~50 cm; if Officer B had remained at that proximity to officer A in the photo for 1 hour, he would have received a dose equivalent to 0.12 dental X-rays. In our worst-case scenario, a paratrooper carrying a loose disk in his pocket for 18 hours (Case 2 in Figure 4) would have received a radiation dose equivalent to 416 dental X-rays (i.e., ~2,080 mSv). Other examples in our wartime scenarios yield less serious doses, but there are some serious concerns for collectors who keep and store these disks today.
COLLECTION, EXHIBITION, AND STORAGE The phosphorescent disks remain collectible items for many World War II enthusiasts, but it is clear that some precautions are warranted. First and most obviously, because the half-life of Ra-226 is 1,600 years, the disks remain radioactive and emit gamma radiation that can be quite harmful if the disks are handled for a long time or are placed close to people. The danger is not restricted solely to the emission of gamma radiation but also extends to dust that may settle on the disks and to the potential accumulation
Experiment setup with scientific instruments.
of radioactive radon under certain storage conditions. Some safety considerations include the following points: Both disk designs we tested emit gamma radiation, but at different levels. We assume that all disks still in circulation also emit gamma radiation. All disks should be handled accordingly. Broken disks or ones with cracked domes should be avoided entirely. Ideally, the disks should not be handled with unprotected fingers or hands. Any time a disk is handled directly by unprotected fingers or hands, a thorough washing of the hands is advisable to remove any radioactive dust that may have been transferred to the skin from the disk. When a disk is purchased at a show or other venue, it should not be carried in a pocket of your clothing. Pockets in your pants place the disk in relatively close proximity to reproductive organs; shirt pockets place the disk in close proximity to the heart and lungs. Newly acquired disks are best transferred immediately to secure storage and not carried on your person.
augmented with additional lead lining on all sides (total ~ 5 mm lead thickness on all sides; Figure 6), the dose rate was 8 mSv/h at a distance of 2 cm from the box, a reduction of 98.4% from the open-air emission. Endnotes: 1.
The disks are inappropriate for ‘show-and-tell’ events at schools, collector meetings, etc. They should not be passed around for handling by persons of any age. Normal open display cases or closed glass-fronted display cases will not significantly attenuate or stop the gamma radiation emitted by the disks. Closed display cases also will allow the accumulation of radon, an odorless radioactive gas that is a natural decay product of radium. Completely sealed display cases will allow radon accumulation that is dangerous to inhale when the case is opened after a long period of closure. Display cases with key holes or other openings will allow the radon to escape into the room. A higher number of disks will increase the radiation containment problem. The best storage option for disks is lead-shielded containers or casks specifically designed for storage of radioactive materials. Simpler, lead-lined box storage may well provide protection from a low number (one or two) of WWII phosphorescent disks. When in the open air, the two disks we used in our experiments emit a combined radiation dose rate of 504.7 mSv/h at a distance of 2 cm (the sum of the dose rate of the plain-disk and clip-disk in Experiment 1). When the two disks are placed in a small, wooden box lined with 1 mm of lead (Figure 5), the emission dose rate is reduced to 60 Sv/h at a distance of 2 cm from the box, a reduction of 88.1%. When that box was placed in a larger box that was
ORAU Museum of Radiation and Radioactivity. Radioluminescent Personnel Markers 1950s). https://www.orau.org/health-physics-museum/collection/radioluminescent/personnel-markers.html (accessed March 18, 2025). Bell, Jack, and Christopher J. Bell. 2023. Weapons and Equipment of American D-Day Paratroopers. Privately published, Austin, Texas. 75 pp. [See p. 57]. De Trez, M. 1994. American Warriors. Pictorial History of the American Paratroopers Prior to Normandy. D-Day Publishing, Wezembeek-Oppem, Belgium. 211 pp. [See pp. 86, 90, 192, and 193]. Andreasen, B. 2025. Radiation from dental X-rays. https://www.radiodontics.com/radiation-from-dental-x-rays/ (accessed March 18, 2025). Experiments 3 and 4 and Experiments 5 and 6 are complementary pairs. Results of Experiment 3 and 6 yielded comparable dose rates. Experiment 4 yielded a dose rate that is approximately 36% lower than the rate recovered from Experiment 5. We ran four iterations of Experiment 5 and values were different for each, ranging from ~55 to ~75 ~mSv/h. The variation likely resulted from small variations in placement and orientation of the disk and detector in each iteration. We used the highest recovered value to emphasize the maximum potential impact. We assumed that the length of the foot of officer B (segment a-b on the photo) was between a minimum shoe size of 7 and a maximum size of 13 (between approximately 24 and 30 cm). We used that to establish a proportion for the distance between officer A and officer B (segment c-d on the image), yielding a rough estimate of 40 cm distance.
About the Authors
Christopher Bell is a Professor in the Department of Earth and Planetary Sciences at the University of Texas at Austin. He is a paleontologist and evolutionary biologist by training but maintains a strong interest in the history of science and military history.
He recently began a research project investigating the impacts of 20th-century wars on the study of zoology, geology, and natural history.
Nicola Tisato is an Associate Professor at the Earth and Planetary Sciences Department of UT Austin. He is a rock physicist and principal investigator of the Rock Deformation Laboratory. He earned a Doctoral degree from ETH Zürich and a Master’s from the University of Padova. Nicola is a caver and loves mountains. He comes from the northeast of Italy, directly from a WWI battlefield and theatre of some of the cruelest chapters of the Italian campaign during WWII. Because of that, Nicola has always been interested in understanding more about international conflicts.